Sugoi Todo - A simple ToDo app

Motivation
This app is slightly inspired by Agile Software Development. Estimating tasks relatively and quickly, and performing tasks and monitoring the status by various visualization tools. This app may best fit for individual developers. But it is just a kind of ToDo app and it can also be used in daily life.
Basic Usage
When the app is started, the default project "Tasks" is opened. It is suitable for storing miscellaneous tasks.

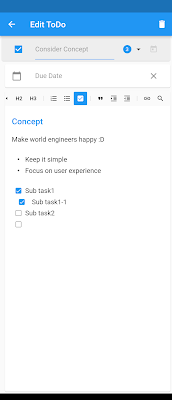
The basic usage is the same as other ToDo apps. Entering Task Name, Due Date, etc. and tap the upward button to add tasks. And completing tasks by tapping check box.

A characteristic field would be "Task Point". It allows you to specify relative task weight (as similar to "Story Point" in Agile). This value will be used for visualization with various charts.

Creating a Project
Project is suitable for organizing tasks for a middle or long term of goals (a few months ~ 1 year, etc.). To create a new project, tap the left-top hamburger menu and press the bottom [+] icon of the side navigation.
In the New Project dialog, enter Project Name, Theme Color, Due Date (optional), etc. and tap the Create button. A new project will be created and opened.


Project Planning
Let's start the project planning. Write the necessary tasks with task points (rough estimation) to accomplish the middle or long term goal. It doesn't have to be perfect. If there are any missing tasks, let add them later.

You can change the order of tasks by long-pressing them. It is recommended to order the tasks by priority (Top is the highest priority).
Perform Tasks
After the planning is done, let do tasks step by step. If necessary, you can write rich text notes for each task. Especially check boxes and bullets are useful. When the task is done, tap the check box to mark as completed.
Viewing Project Analytics
While the project is in progress, you can monitor the project status by Analytics tab. Note that Analytics will be available by watching ads (Available for 3 days by a watch).
Velocity Chart visualizes the productivity (how many points you've completed). You can monitor whether productivity is getting better or not.

Heatmap Calendar visualizes the continuity of this project.

Burnup Chart visualizes the progress. There are multiple lines as shown in the picture below.

Some Notes:
- Ideal line is available when "Due Date" is set for the project.
- Predicted line is available when there are completed tasks in the last week (Mon - Sun).
Completing Project
When the all tasks are completed, a confirmation dialog will be displayed (with confetti celebration🥳). Press "Complete Now" to complete the project.

If the project is completed, the project report will be available in Analytics tab.

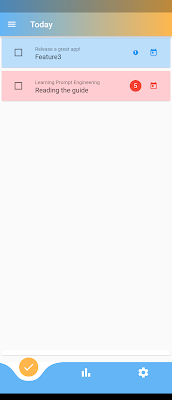
Today's View
This view allows you to list the today's tasks across multiple projects. You can open this view from "Today" menu of the Side Navigation.
To add tasks to today's list, tap "Today" icon of each task from each project.

You can change the order of tasks by long-pressing task. This order is independent on order of tasks in each project. It is recommended to sort them in the order you plan to do.
Today's Analytics
You can see today's analytics from the Analytics tab as shown in the sample picture below.

At the End
Thank you for reading! If you are interested in this app, please Get it from Google Play and try it!

Comments
Post a Comment